In December and January we observed widespread and long-lasting flooding in Germany.With Sentinel-1 data you can map the spatial and temporal dimensions well. The full report you may find here.
For the field crops winter wheat , winter barley and winter rapeseed we made a yield prediction on a farm in Germany with quite a good result. The full report you may find here.
In the Ukraine the Kakhovka dam was destroyed. The flooded area was monitored with Sentinel-1 SAR data. The article with few maps showing the situation before and after the event you find here.
In northern Italy is the biggest rice cultivation area of Europe. The ESVI allows to monitor the irrigation regime and the growth of biomass in the rice paddies.
The full article you find here.
We use Sentinel-1 SAR data and generate a vegetation index out of it. This vegetation index ESVI can be transformed directly and precisely in yield for various field crops. We don’t need additional data like weather or soil data.
The full article you find here.
For a region in Germany / Thuringia we modelled the yield for arable crops like wheat, barley and rapeseed based on #Sentinel-1 #SAR data.
The full article you may find here.
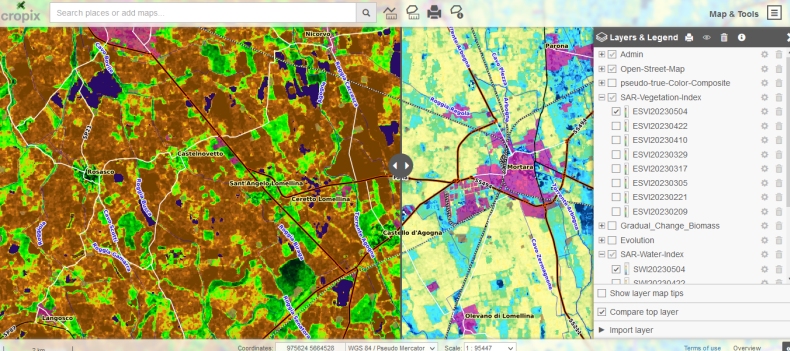
A new showcase in iMap presenting our popular map products like #ESVI (enhanced SAR Vegetation Index), #SWI (SAR Water Index), #CC (pseudo-true Color Composite), #EVO (Evolution) a color composite over a period of 3 succeeding acquisitions based on ESVI and #GCB (Gradual Change of Biomass), which is a map product that shows the recent change based on ESVI.
The full article you find here.
We used #Sentinel-1 #SAR data and here our vegetation index #ESVI to demonstrate that the detected footprint compares very well with optical infrared data from #FIRMS. Occasionally it may happen, that optical data is disturbed by dense smoke. Despite to that SAR can penetrate aerosols and clearly indicate the destroyed area.
You can download the article.
A drought hits Argentina. We analysed SAR data of 4 succeeding years to show the differences of the humidity in vegetation.
A pdf-file with the full article you find here
We use cookies to enhance your experience while using our website. If you are using our Services via a browser you can restrict, block or remove cookies through your web browser settings. We also use content and scripts from third parties that may use tracking technologies. You can selectively provide your consent below to allow such third party embeds. For complete information about the cookies we use, data we collect and how we process them, please check our Privacy Policy